Three KPIs, viewed one at a time
A simple snapshot gives you the headline numbers, with limited context for finding patterns.
Current staff1,233
Total attrition237
Staff satisfaction2.8 / 4
Type a word or phrase to find a page.
We bring sales, money, stock, and customer information together so you can see what is working and choose what to do next.
We help you make better use of the tools your team already uses, from spreadsheets and reports to sales and finance systems.
See how the same workforce measures become easier to understand when they are brought together in one view.
A simple snapshot gives you the headline numbers, with limited context for finding patterns.
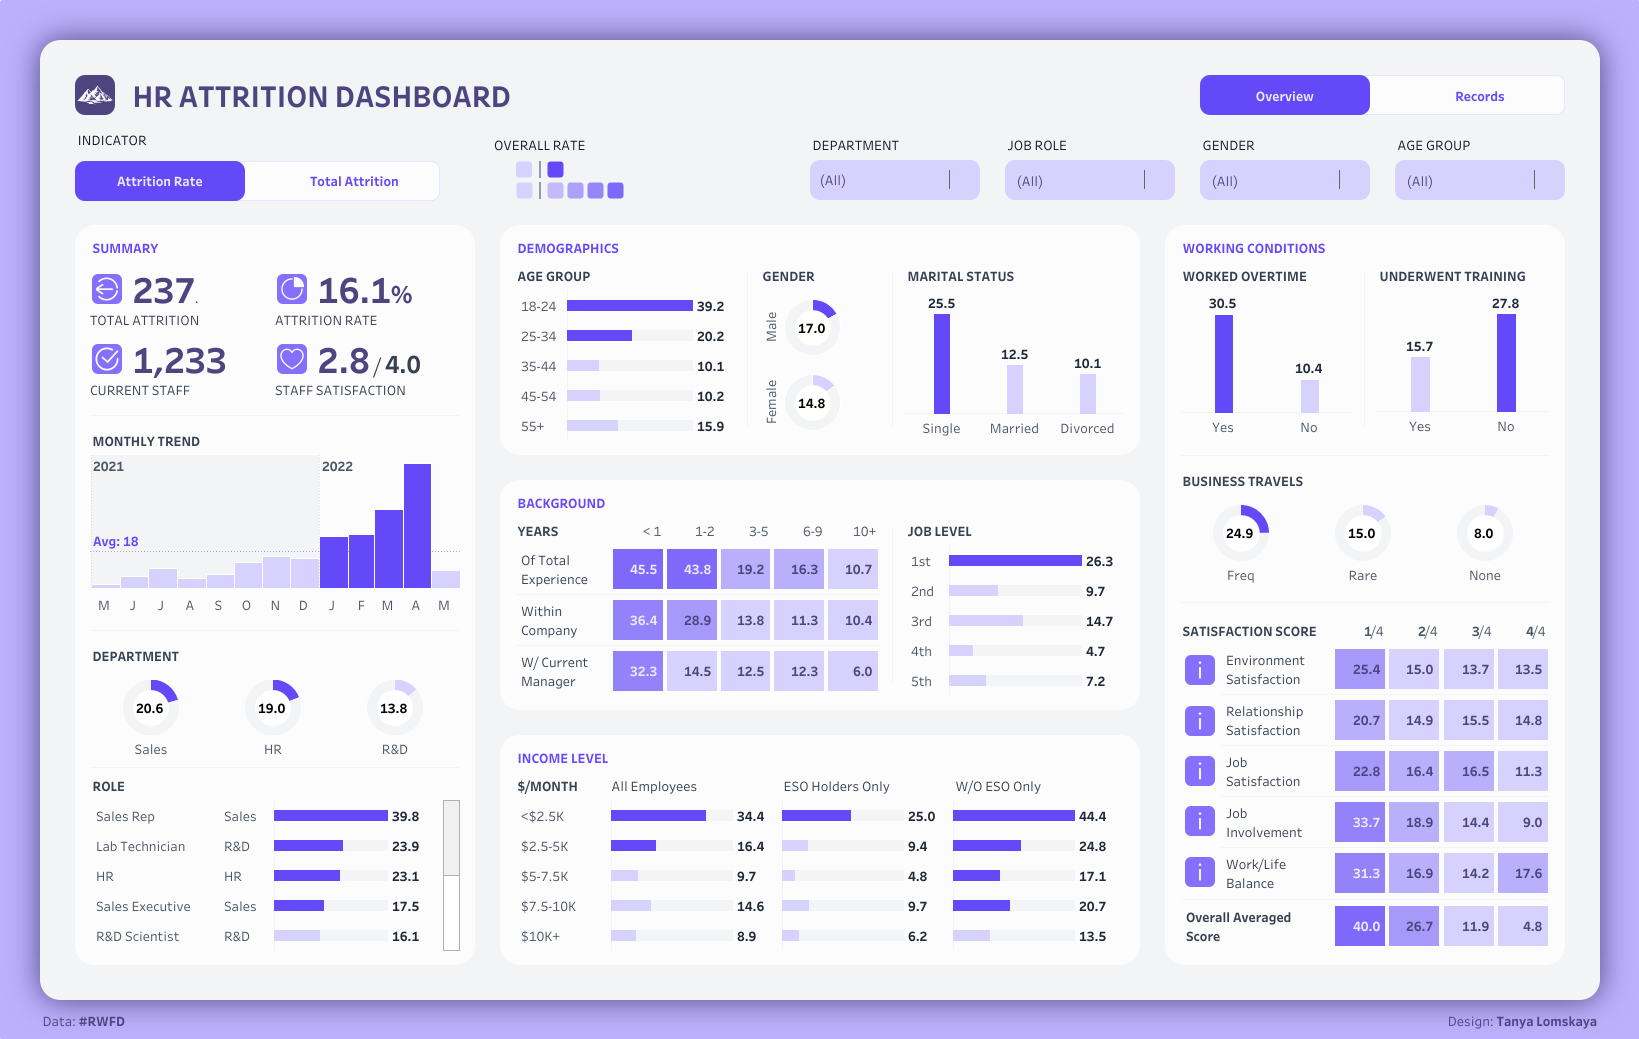
After analytics HR dashboard view of the same workforce data, with trends and breakdowns in context.
Browse examples of sales reports, staff analysis, and business dashboards.
Clear reports on income, costs, customers, and daily work.
Bring customer, stock, sales, and finance information into one clear view.
Use Python to handle repeat reports and reduce manual tasks.
Choose a clear next step for your business.